Feature
Someone changed your spreadsheet. Do you know what?
Updated August 31, 2026
Quick answer
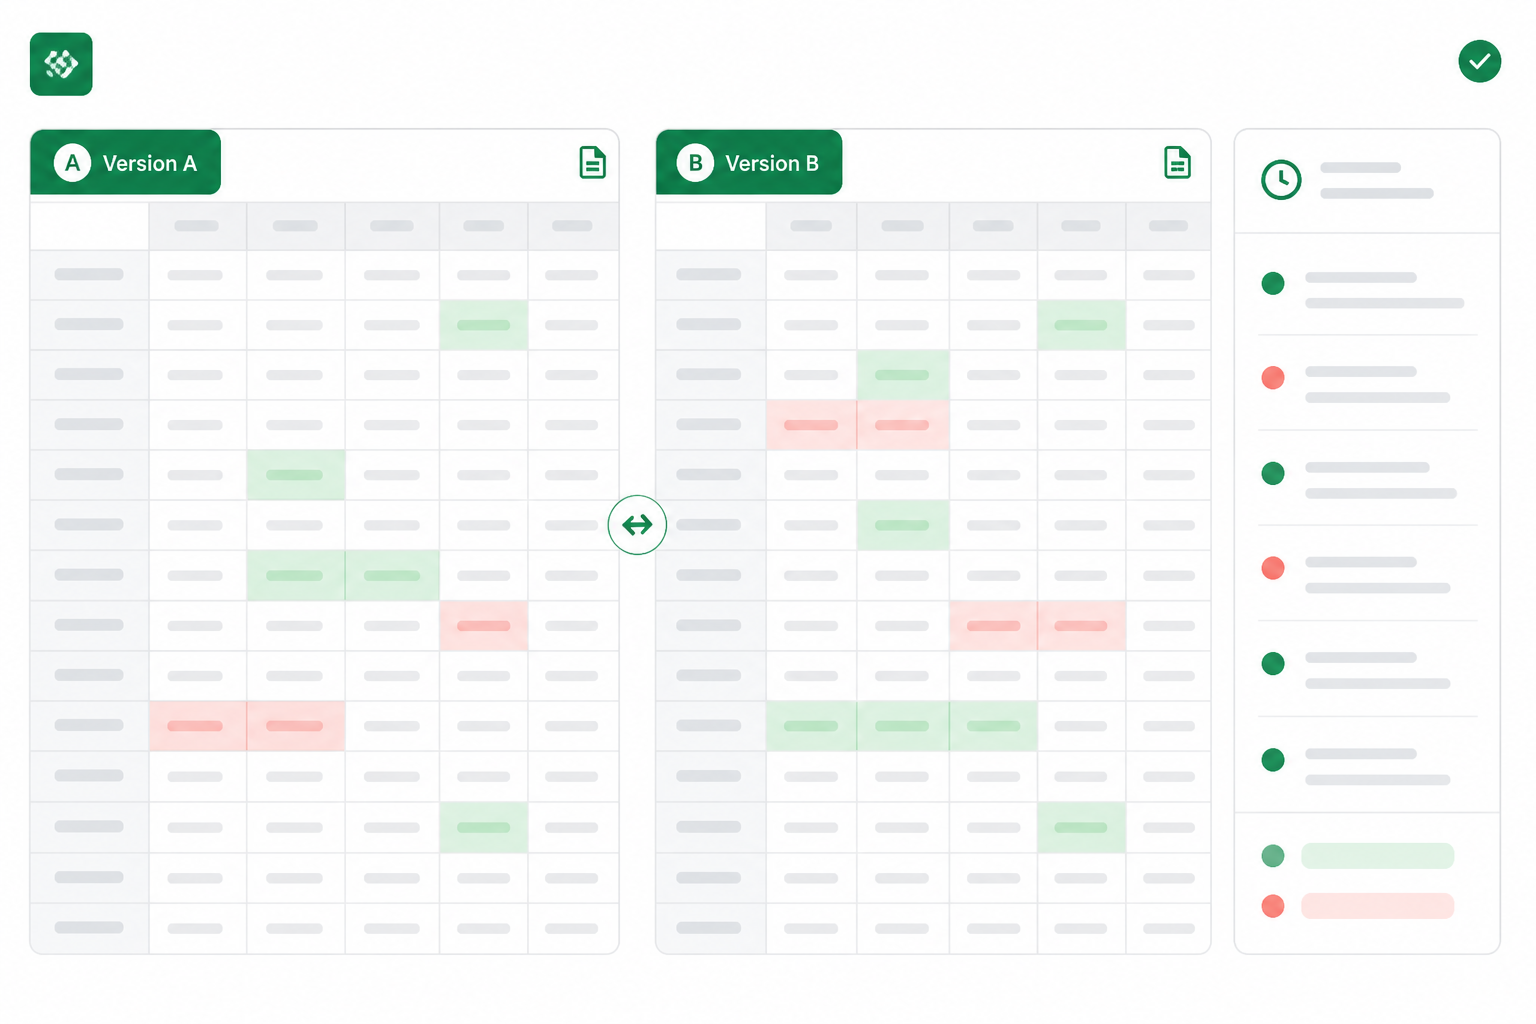
Upload the old file and the new one. We highlight every change — numbers, formulas, colors, charts — in a grid that looks like Excel. No scrolling row by row. No CSV export. Most people find every edit in minutes.
Sound familiar?
- You got "budget v3 — please review" with 30 minutes until the meeting.
- Scrolling row by row isn't realistic on a 40-tab model.
- Exporting to CSV loses formulas, charts, and formatting.
- You're afraid to approve something you haven't actually checked.
Upload two files. See every change highlighted.
Drop in the old version and the new one. Changed cells light up in a grid that looks like Excel — not a wall of text. Click any change in the list to jump straight there.
- Numbers, formulas, fonts, colors — all flagged
- Charts and images too, not just cell text
- One grid or side-by-side — your choice
- Runs in your browser. Nothing to install.
Why this beats scrolling or CSV export
Without a visual diff
Miss a formula change. Approve the wrong version. Find out in the meeting.
With Excel Change Log
Every edit is visible in minutes. Approve with evidence, not guesswork.
Frequently asked questions
What is a visual Excel diff? ▼
Two Excel files side by side (or merged into one grid) with every change highlighted. You see values, formulas, formatting, charts, and sheet changes — the way the file actually looks, not as plain text.
How is this different from comparing CSV exports? ▼
CSV drops formulas, charts, formatting, and extra sheets. A visual diff compares the real .xlsx file — so the edits that break models don't disappear.
Do I need Excel installed? ▼
No. Open your browser, upload two files, and review. Nothing to install.